I would like to keep this short & Sweet for a while as I’m running out of time but the move that U.S exchange took on Friday by delisting Chinese shares would really impact highly on upcoming trade war decisons.
But before throwing more light on U.S-China trade war, I would like to show you how we perfom in september. Its last couple of days & I’ve not decided to step into the market till the new month stars.
This week has lot to offer. Update by Saudis on how much damage was made by strikes on Oil production station on Monday & also the most important Non-farm payroll coming Friday
Price Action Analysis on October 1st 2021
Scalp opportunity on offer on usdjpy
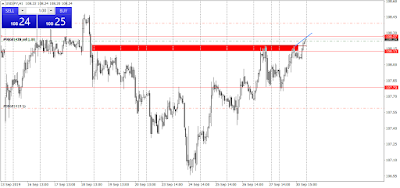
I’ve spotted an opportunity on usd/jpy, which is a very low risk reward opportunity. Currently price is approaching 108.30 area, which is the defining the current trend in usdjpy & good line of defence for bears & when bulls approach attack this area, bears start to dominate again. I would put my stops just above the next base 108.35 around 108.49 to be exact and my take profit target would be around 107.60 area.
Take a look at the chart
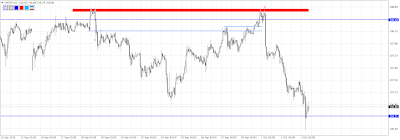
Stop hunting process was repeated and rentry was forced on 108.22
Let’s explain the whole process in the easiest way one could. We set up a pole that berakout and make a new high & since the low was confluence of the move and lower low of the range . We saw rejection just below the level and price made a base before retesting it with compression.
Compression is a set of orders which are filled or left unfilled during a move. When it reach the source of the move it usually have maintain a imbalance and price dropped sharply amid supply and demand imbalance.
I’ve market few important points on the chart below which you should take in notice while taking such trades.
1.
Pole makes a breakout and new higher high
2.
Price breaks the range with a small base and decision point is strong enough & carry momentum to make a new lower low
3.
Whenever we see a drop and a base within a single bullish candle and range bound bearish candle & then drop and retest of the level, tighten your screws and put the stop above the high and let the trade unless we have high impact news is due to release or we see a engulf of flag opposite side of the Price Action


